An Intuitive Understanding of the Significance of SE in a Sample Mean Distribution
- Annauen Ravacio
- Jan 4
- 1 min read
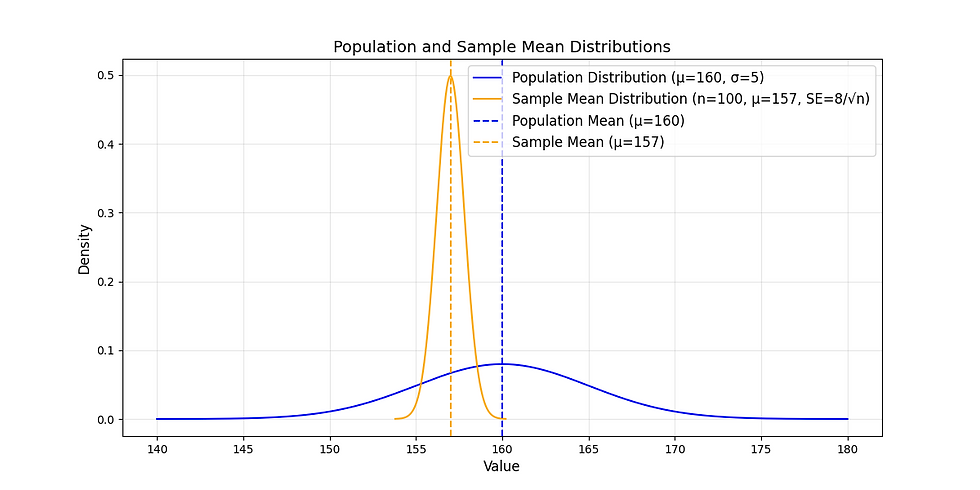
Do you wonder why we reject the null hypothesis that the population mean is 160 and conclude that the population mean is not equal to 160?
With the population standard deviation equal to 5 cm, 157 cm is near 160 on the normal curve, right?
Answer: When considering the sampling distribution of the sample mean, we focus on the spread of the sampling distribution curve, not the population curve we have hypothesized.
Given the Standard Error (SE) in this graph, the sample mean distribution is narrow, indicating that there is less variability in the sample means within the sampling distribution.
Therefore, there is a higher probability that the sample means will be close to 157 rather than 160, leading us to reject the null hypothesis that the population mean is 160.
This makes 160, as the hypothesized mean, an unlikely estimate, while 157 becomes a more reliable estimate of the population mean.
Comments